- Insights
How Scientists Measure Biodiversity
Forests are crowded places, home to roughly 80% of the world’s terrestrial biodiversity, with millions of species competing with and depending on each other for survival. This incredible biodiversity is often one of the key reasons for protecting forests— to preserve the vast variety of life on Earth. But just what is biodiversity anyway, scientifically-speaking? How do biologists and conservationists measure it to determine which ecosystems are “the most” biodiverse? And how exactly should these measurements of biodiversity inform what we decide to protect?
How biodiverse is that forest?
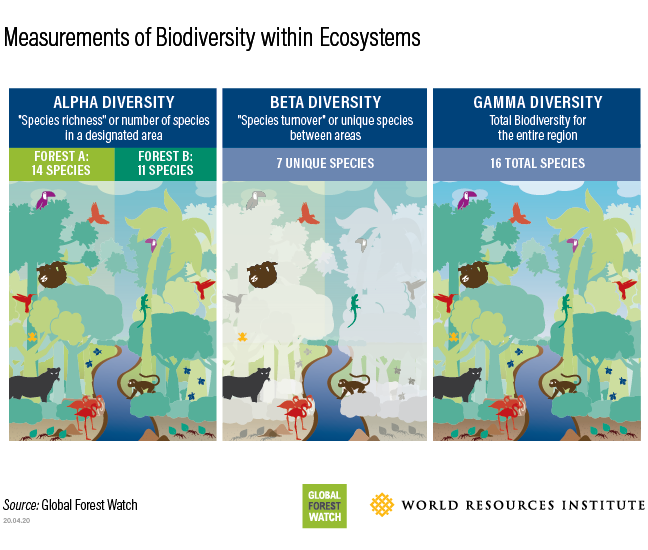
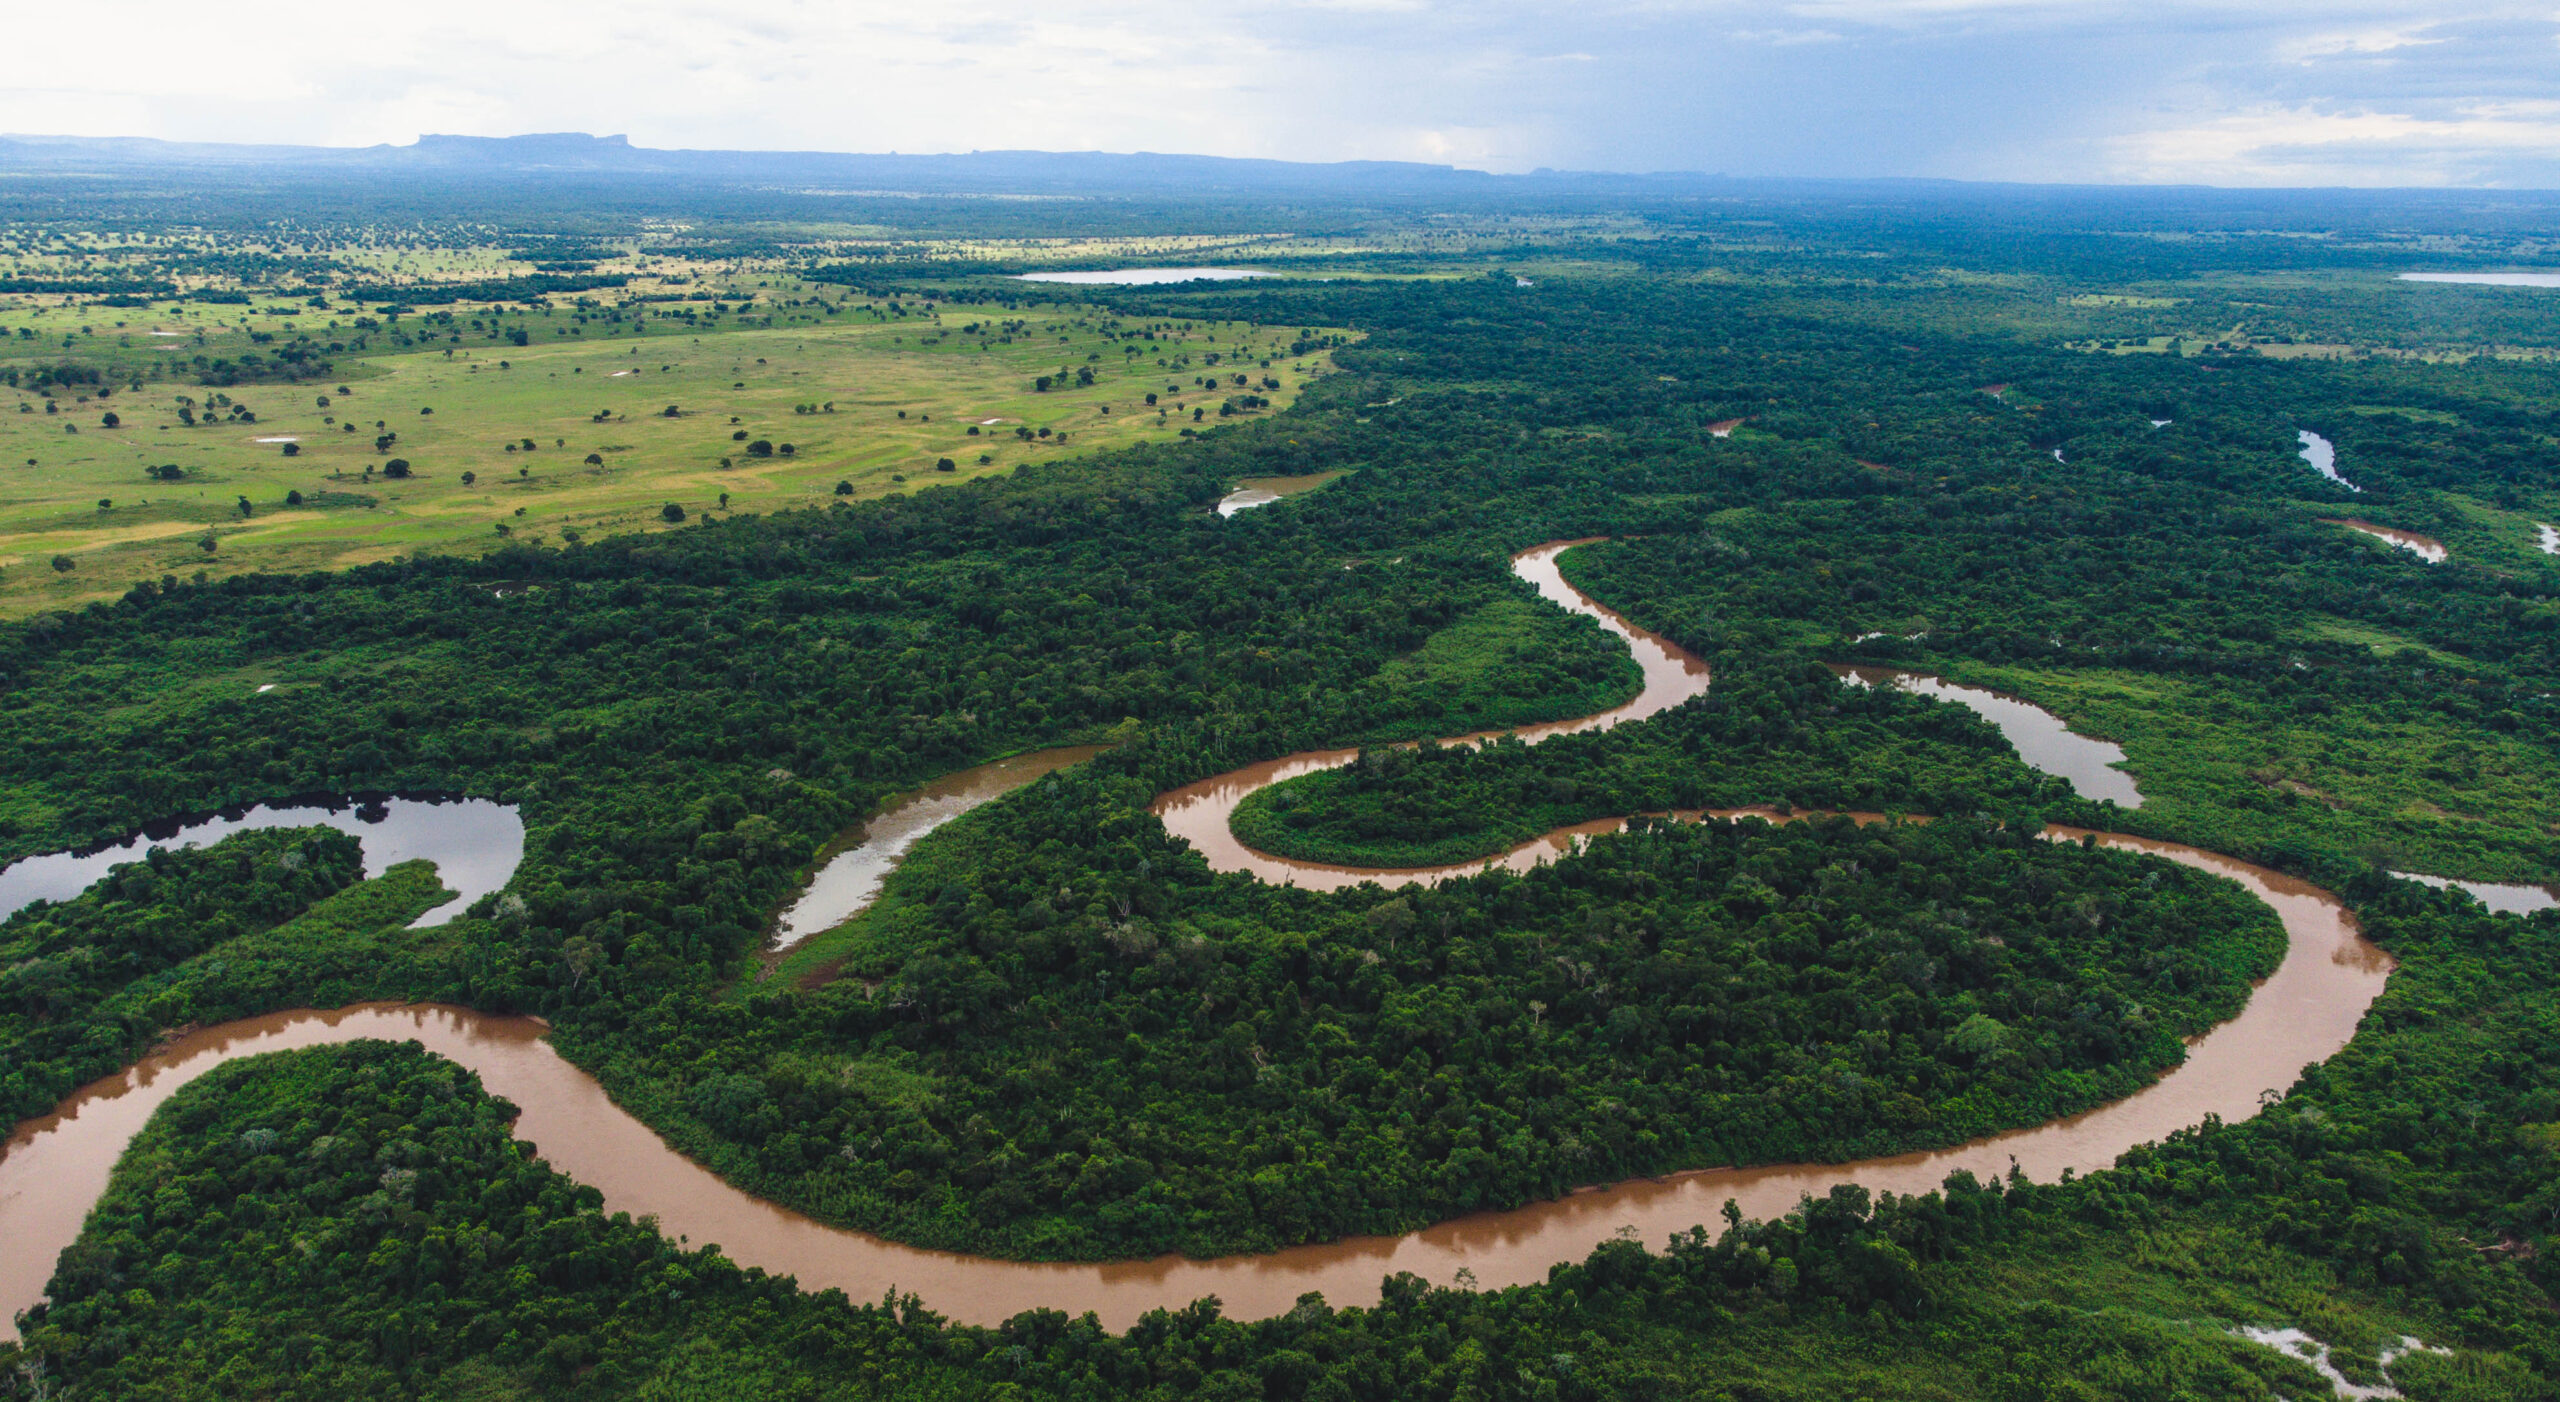
To understand the way scientists assess biodiversity, imagine a forest. It is split by a river and although it is all one forest, the communities of species differ slightly from one side of the river to the other. If we draw a boundary around either portion of the forest and count the number of species we find there, we have a measure of species richness, termed “alpha diversity” in scientist-speak.
But richness alone doesn’t paint the whole picture. By numbering the species on each side of the river you can find the alpha-diversity of each, but these counts don’t allow for comparison of uniqueness between the two forest communities. For that, ecologists turn to ”beta diversity“, otherwise known as species turnover, or the number of species unique to each community. Although one side of the river may host more species, the other may hold a more unique assemblage, thereby making it an important contributor to the overall biodiversity of the forest.
Scientists combine these two measures using a variety of equations and indices to calculate the total value of biodiversity or “gamma diversity” for the whole ecosystem. This value provides a tool to help conservationists compare the relative diversity of ecosystems or regions and begin to prioritize areas of most concern for protection.
Where quantitative measures of biodiversity fall short
Despite gamma diversity’s usefulness in assigning a value of biodiversity for easy comparison, there are some things that numerical estimates of biodiversity don’t convey.
For one thing, the simple act of counting species is more complicated than you might think. Estimates of the total number of species on the planet fluctuate wildly, from 3 million to 100 million, with the most precise measurements to date hovering at around 8.7 million. Most of these are as-yet-undescribed by science. In attempting to number species for even one fraction of one ecosystem, there will always be some that go undetected for the sheer enormity of species there are to count. Add to that the fact that drawing a line between one species and another isn’t always as simple as sorting out the squares from the circles. So-called “cryptic species” can appear almost indistinguishable from described species but differ enough on a genetic level that they form their own taxonomic group.
With advancements in DNA sequencing, detecting these species is becoming easier, but these advancements have opened a whole new level of biodiversity to consider. Genetic diversity within a single species is also important to conserve, as more versions of genes and the traits they control give a species a greater chance of surviving a disturbance like climate change.
Beyond the difficulty of getting an accurate species count, measurements of overall biodiversity don’t always represent the relative importance of certain species to the health of the ecosystem. Some “keystone species” have an outsize impact on ecosystem functions—meaning that a dramatic change in their populations, or their loss altogether, can change the balance of the ecosystem. The wolves in Yellowstone Park are a common example. Their reintroduction to the park has changed the behavior of their prey species, altered the distribution of plants, recreated lost niches for small mammals like beavers and foxes and even affected the physical geography of the landscape.
Conserving biodiversity to protect our future
So, a great variety of factors need to be considered when assessing what areas require the most rigorous protections for biodiversity. Returning to our imaginary forest, what if some of the species found on one side of the river were not just unique in that region, but found nowhere else in the entire world? Or if the butterflies found on both sides each held unique variations on a gene? Or if the existence of the forest itself depended on just one tree species? What would you decide to protect then?
Holistic assessments of the biodiversity value of one region over another must account for the complex interactions between species, for it is often in these interactions that the ecosystem services humanity depends on arise. The future of just one species depends on the continued existence of more creatures than we can even count. In safeguarding biodiversity, we protect ourselves.
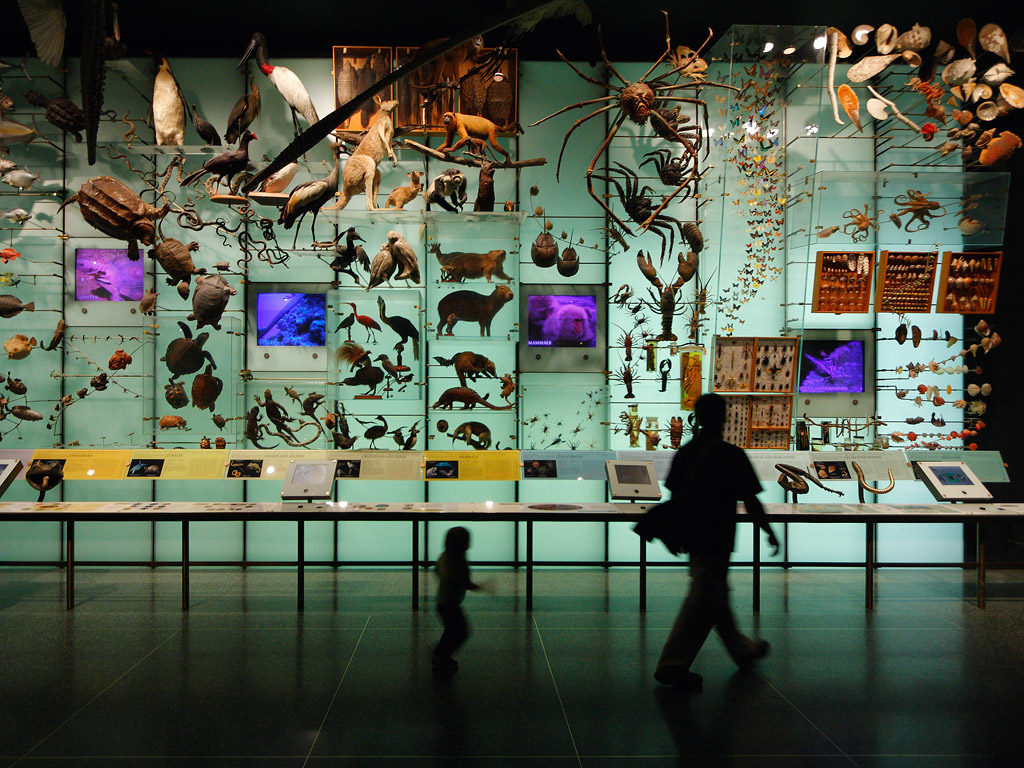
BANNER PHOTO: Hall of biodiversity at the American Museum of Natural History. Photo by Dominik/Flickr.
Explore More Articles
Explore More Articles


