- Data
What You Need to Know About GFW’s 2019 Tree Cover Loss Data
Jun 02, 2020||6 minutes
Languages
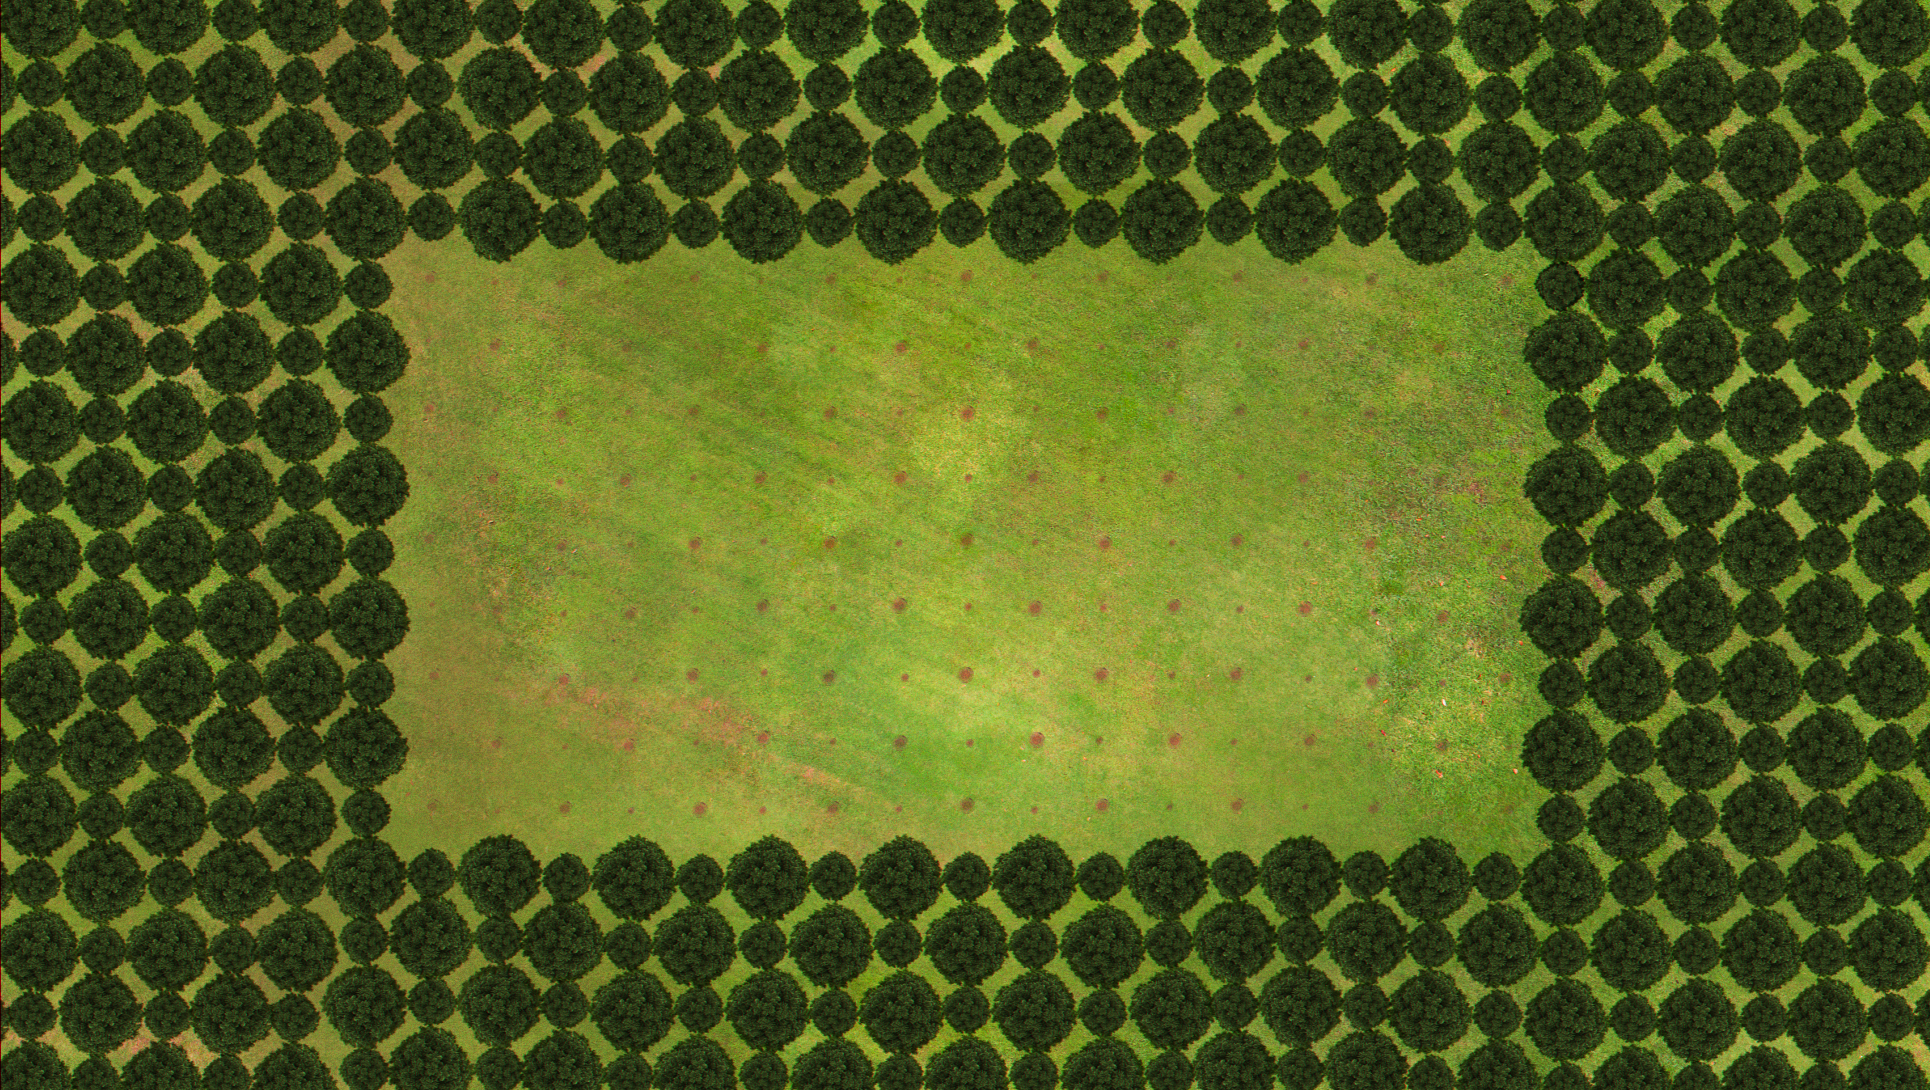
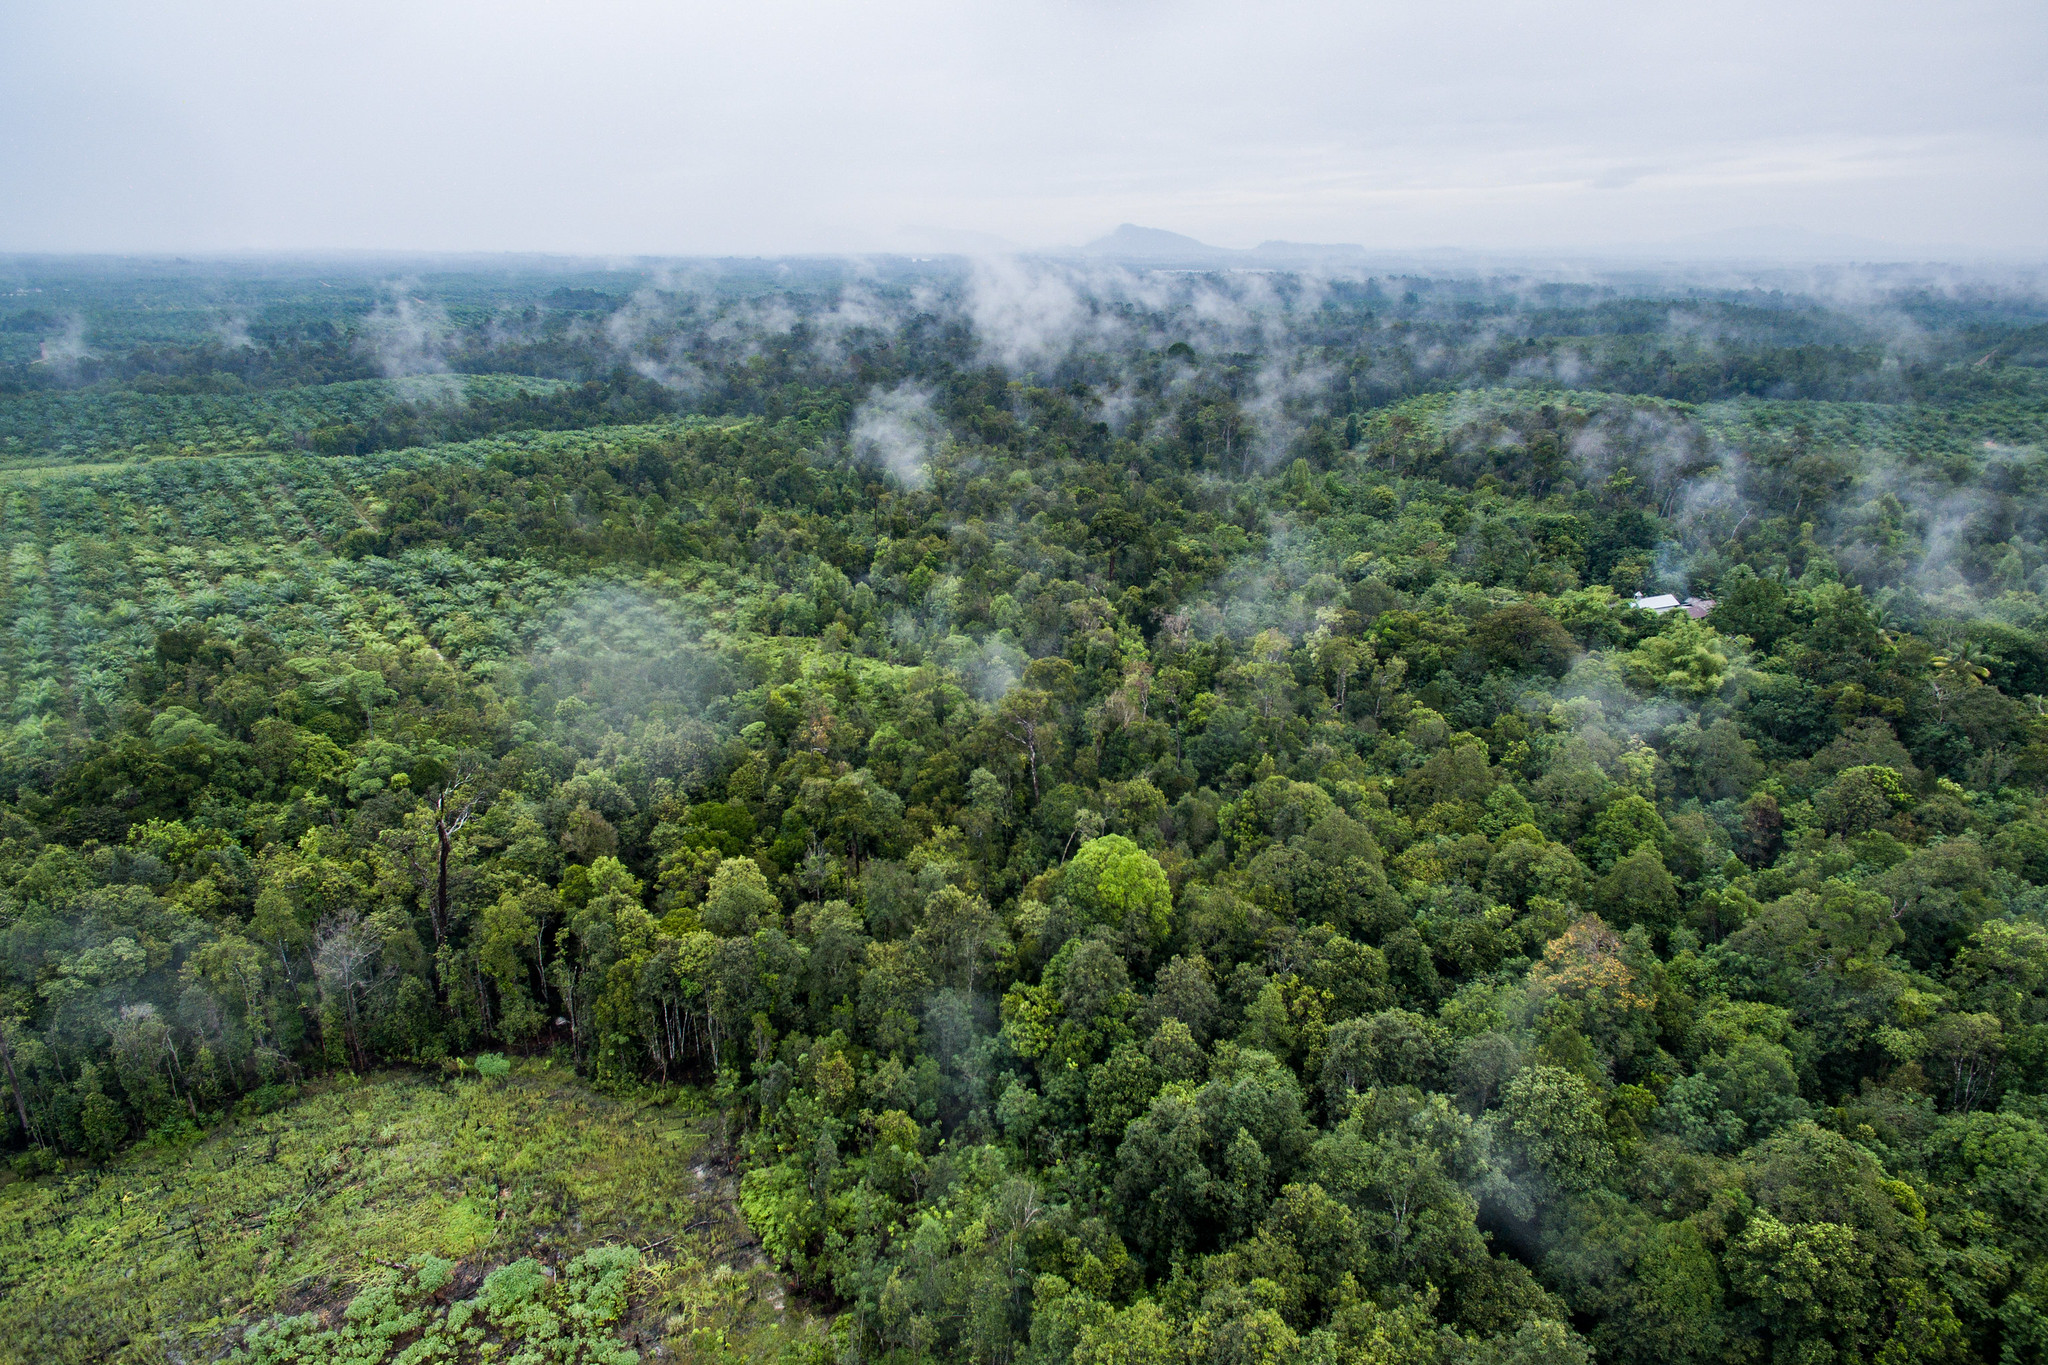
Every 6 seconds in 2019 1 football pitch of forest was lost.
New data from the University of Maryland (UMD), released on Global Forest Watch, shows that tropical primary forests sustained high losses in 2019. But what does this data show about the causes of loss, and how does it compare to the other estimates of loss out there? Here’s what you need to know about the UMD data.
Tree cover loss is not necessarily deforestation
Tree cover loss refers to a disturbance of woody vegetation over five meters in height— whether that’s in mature primary forests, secondary forests recovering from past disturbance, or tree plantations. In order to hone in on loss in natural, mature forests, GFW focuses our analysis more specifically on humid tropical primary forest loss. These forests typically have high carbon and biodiversity values and once they are lost, it can take decades or even millennia to grow back to anywhere near a primary forest state.
Still, the data does not yet differentiate between the causes of loss, which can vary from natural disturbance, to anthropogenic fires, to clear-cut deforestation. Additional datasets, as well as visual interpretation, can help us better understand what is driving loss.
Other technical considerations can impact the interpretation of UMD tree cover loss data. Multiple iterations of the detection algorithm have been applied across the time series, potentially resulting in inconsistencies, and loss that occurs late in one calendar year is occasionally captured in the following year due to cloud cover.
Fires were both a cause and a symptom of loss in 2019
Fires seemed to be everywhere in 2019. Using MODIS burned area data from UMD, we can better understand how much fire influenced the 2019 loss numbers, though estimates may not capture all fire damage due to cloud cover and haze.
In Brazil, where fires were covered extensively in the media, fires appeared to be a symptom of primary forest loss rather than the direct cause. In the Brazilian Amazon, the density of fires was 20 times greater in previously cleared primary forest than in currently standing forests. And while fires were above average in 2019, only 20% burned in current primary forests, while 30% burned in areas of prior primary forest loss. The remaining 50% occurred in non-forest and secondary forest areas. This was also the case in Indonesia, which saw much higher rates of fires burning in previously degraded forests, and only 6% burning in primary forests.
However, fire can also be a direct cause of tree cover loss. In Bolivia, escaped fires burned large swathes of primary forest and other tree cover. Over half of 2019 fires in Bolivia happened in areas of tree cover and nearly 60% of 2019 loss occurred in fire areas. Australia also experienced unprecedented fires in 2019 – nearly 80% of the 2019 loss data overlapped with burned area.
UMD data monitors different changes than Brazil’s official data
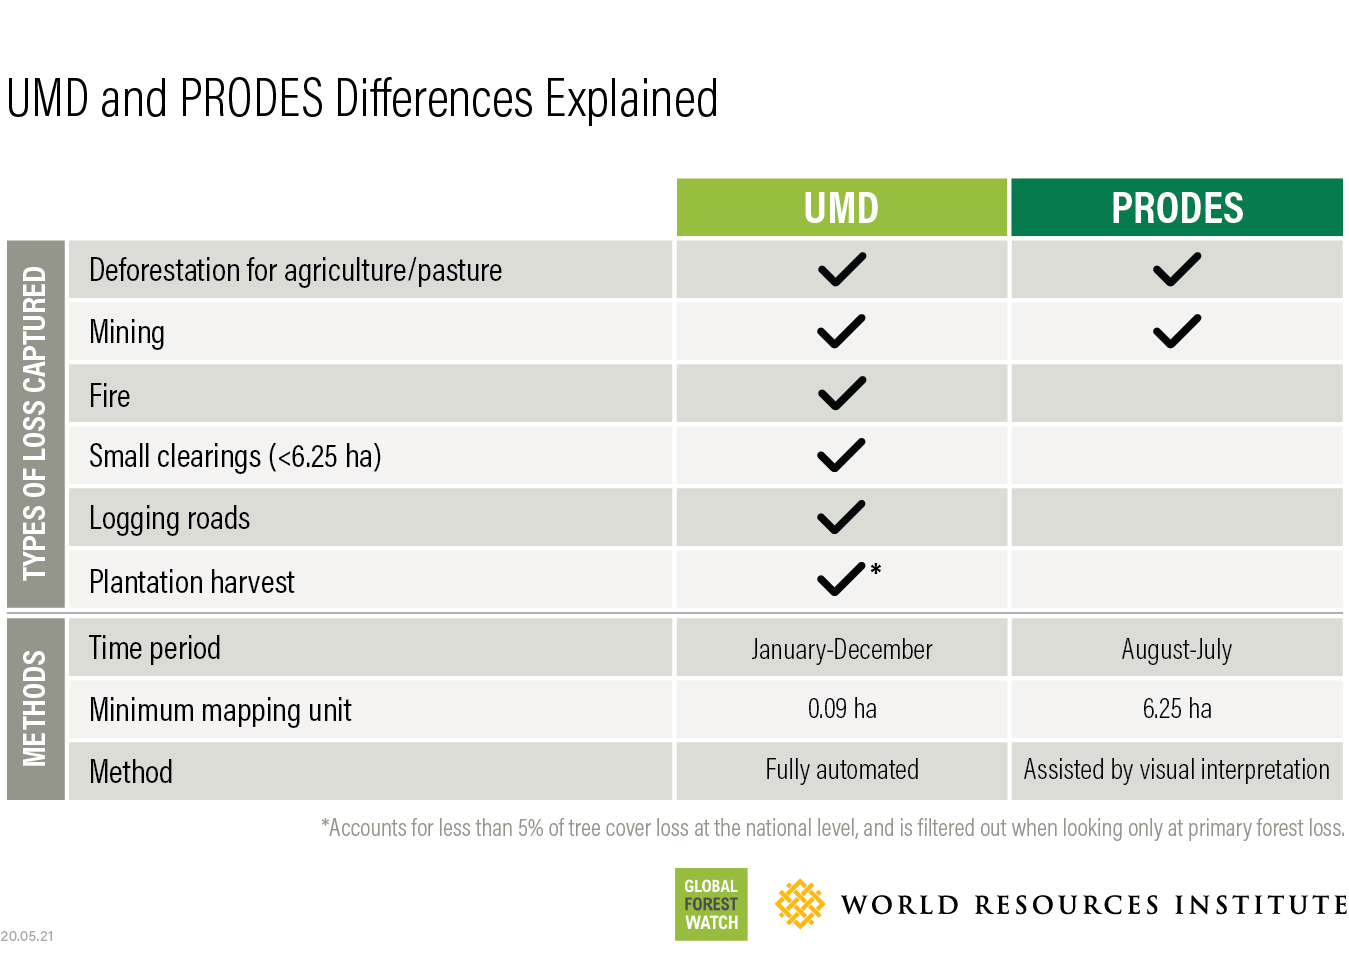
PRODES, the official Brazilian government forest monitoring system, and UMD fundamentally measure two different things, which helps explain why PRODES showed a 30% increase in deforestation from 2018 to 2019, whereas the UMD data only showed a 1% increase in primary forest loss. As we have outlined before, PRODES detects only patches of clear-cut deforestation larger than 6.25 hectares, whereas UMD data captures loss larger than 0.09 hectares of all woody vegetation over 5-meters tall regardless of the cause. These are both critical measures because we need to know where and when permanent deforestation is occurring, which PRODES singles out. However, any tree cover loss, including from fires, can result in impacts on climate, biodiversity and ecosystem services, which UMD data captures.
Because of these differences, the UMD data tends to capture more change than PRODES. Of deforestation detected by PRODES in 2019, over 80% overlaps with areas of UMD primary forest loss from the past 10 years. On the other hand, only 36% of the UMD data from 2019 showed up in the past 10 years of PRODES data.
The difference in scope may also lead to differing trends. While PRODES and other systems clearly agree that clear-cut deforestation is on the rise, the other changes captured by UMD may not move in the same direction. For example, the UMD spikes in primary forest loss in Brazil in 2016 and 2017 were due to understory fires that are not monitored by PRODES – though fires were widespread in the Amazon in 2019, few of them resulted in direct primary forest loss last year.
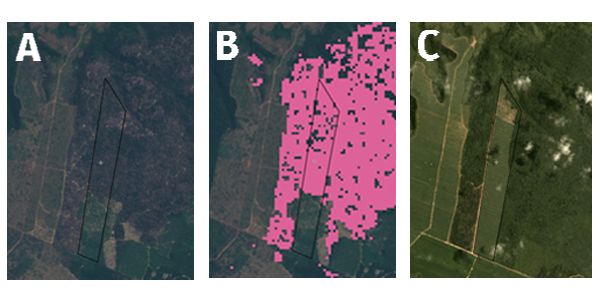 (A) Area of degradation in 2016 (B) loss picked up by UMD data in 2016 and (C) later cleared and picked up by PRODES in 2019.
Similarly, some areas of understory fire and smaller canopy changes detected by the UMD data in past years may have since been cleared and picked up by PRODES. The UMD data only detect the first loss, so these areas would not be captured again when they are deforested, resulting in a potential underestimation of change compared to PRODES that year. Of deforestation detected by PRODES in 2019, nearly a quarter was detected as tree cover loss by the UMD data before 2018.
In addition to the different scope, the two systems also use two different methodologies to detect changes. The UMD data is a fully automated system that analyzes each pixel individually, while in PRODES, deforestation is delineated through visual interpretation of satellite imagery patches. The two also analyze slightly different time periods, with UMD capturing loss over the course of the calendar year, and PRODES capturing deforestation between August and July.
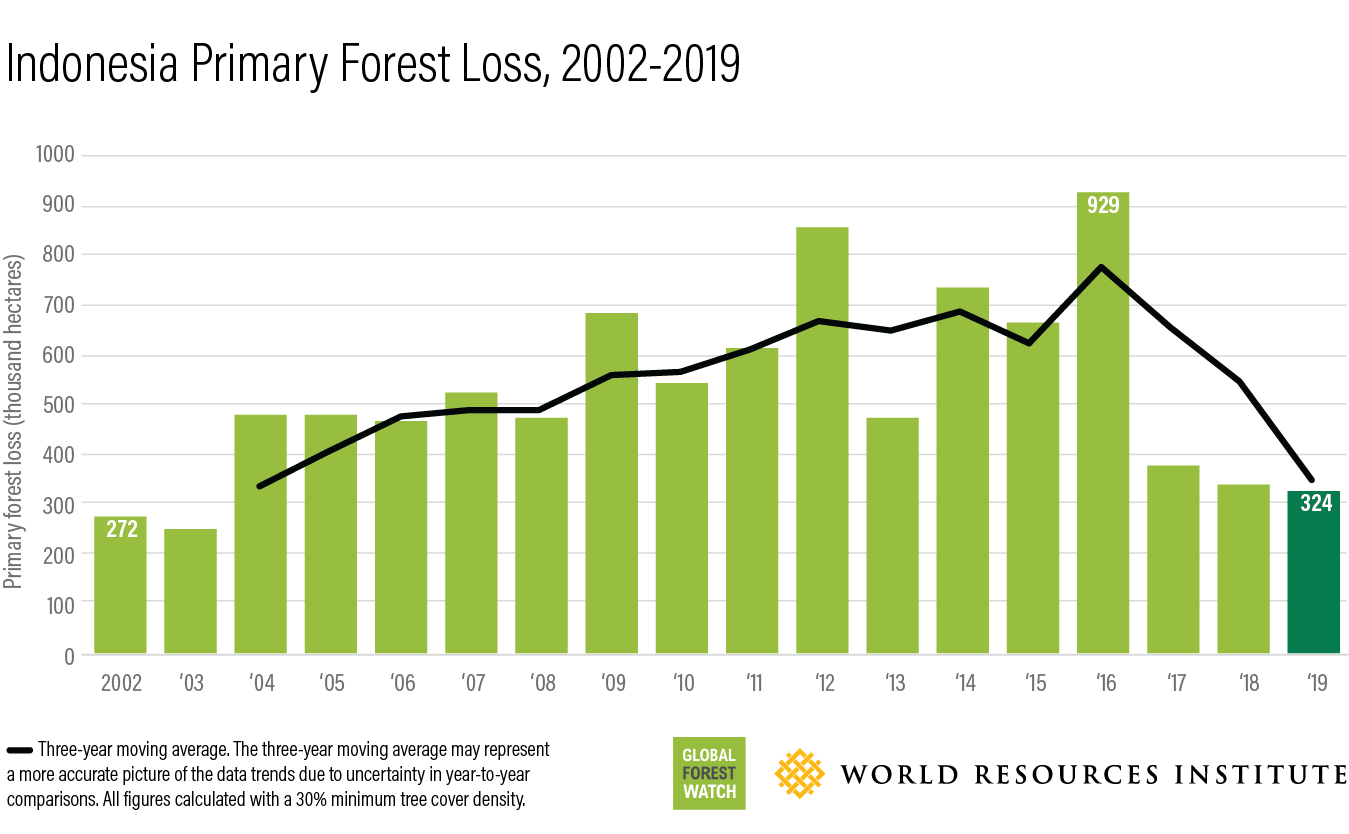
Indonesia’s official 2019 data mirrors UMD trends
Official deforestation data provided by the Indonesian Ministry of Environment and Forestry (MoEF) showed a downward trend between 2018 and 2019, similar to the UMD data. Both data sets also show lower losses for a third straight year after record fire-related losses in 2015 and 2016, despite slightly different values in the area of loss. As detailed in a previous blog, the MoEF data has several differences from the UMD data, including a July to June observation period, a minimum area requirement of 6.25 hectares and visual interpretation of satellite images to determine whether there was forest loss.
What to expect next year from GFW
Early indicators point to a 2020 dry season in the Amazon, and fires in Australia spanned the calendar year, so we can anticipate more fires to show up in the data next year. GFW is continually working to improve our data. Advances from UMD will soon allow us to track repeat instances of tree cover loss over the past two decades, as well as loss due to fire, making it easier to assess what is driving loss and understand how the UMD data compares to other monitoring systems.
Explore the annual data on GFW.
BANNER PHOTO: Every 6 seconds in 2019 1 football pitch of tropical primary rainforest was lost. Photo by Flavio Galvao/WRI.
Explore More Articles
Explore More Articles


